Welcome to the Global Ocean Acidification Observing Network (GOA-ON) Data Portal
GOA-ON works to improve our understanding of global ocean acidification conditions and ecosystem responses by making ocean acidification data easily accessible.
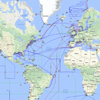
The GOA-ON Data Explorer provides access and visualization to ocean acidification data and data synthesis products being collected around the world from a wide range of sources, including moorings, research cruises, and fixed time series stations. Layers contain contoured world-wide data; Platforms include icons for various observing assets, some of which display real-time data and many of which include links to data and metadata. For a given asset measuring carbonate chemistry, metadata includes information on which parameters are measured, links to data providers, and other useful details. The inventory of GOA-ON assets can be searched interactively by region, platform type, and variables by using the Filters tool.
Would you like to add or modify a platform on the GOA-ON data portal?
Please note that the data portal will be updated in 2023. New or updated platform information will not be visible in the portal until after the update is complete.
Anyone can become a member of the Global Ocean Acidification Observing Network.
For ocean acidification biological response data, visit the portal developed by the OA-ICC.
For more information on GOA-ON's partners, click on the logos below.


Settings
Units
Determines the format in which units are displayed.
Common | °F, ft, ft/s, Hg, etc. |
Scientific | °C, m, m/s, mbar, etc. |
Lat / Lon Format
Determines the format in which latitude and longitude are displayed.
DDD.dddd° | 44.5226 |
DDD° MM' SS.ss" | 44° 31' 21.36" |
DDD° MM.mmm' | 44° 31.356' |
Plot Y-Axis
Determines if plots use a common y-axis for all plots of the same measurement, or if each plot uses a y-axis based on its values.
Global | |
Local |
No Asset Data for Selected Time
Determines what to do when newly selected asset does not have data at the selected time.
Always Ask | |
Select Closest Data Point | |
Do Nothing |